•Data quality & validation — contributed to cleaning and validating the CIHI children and youth mental-health data for downstream analysis
•Data workflow — helped structure and review the workflow from raw-data preparation through cleaned, analysis-ready datasets
•Analysis presentation — supported the presentation and communication of analytical findings, helping turn processed data into clear and understandable insights
How are population-level mental health trends shifting across Canada, and where should public-health attention focus?
Executive summary
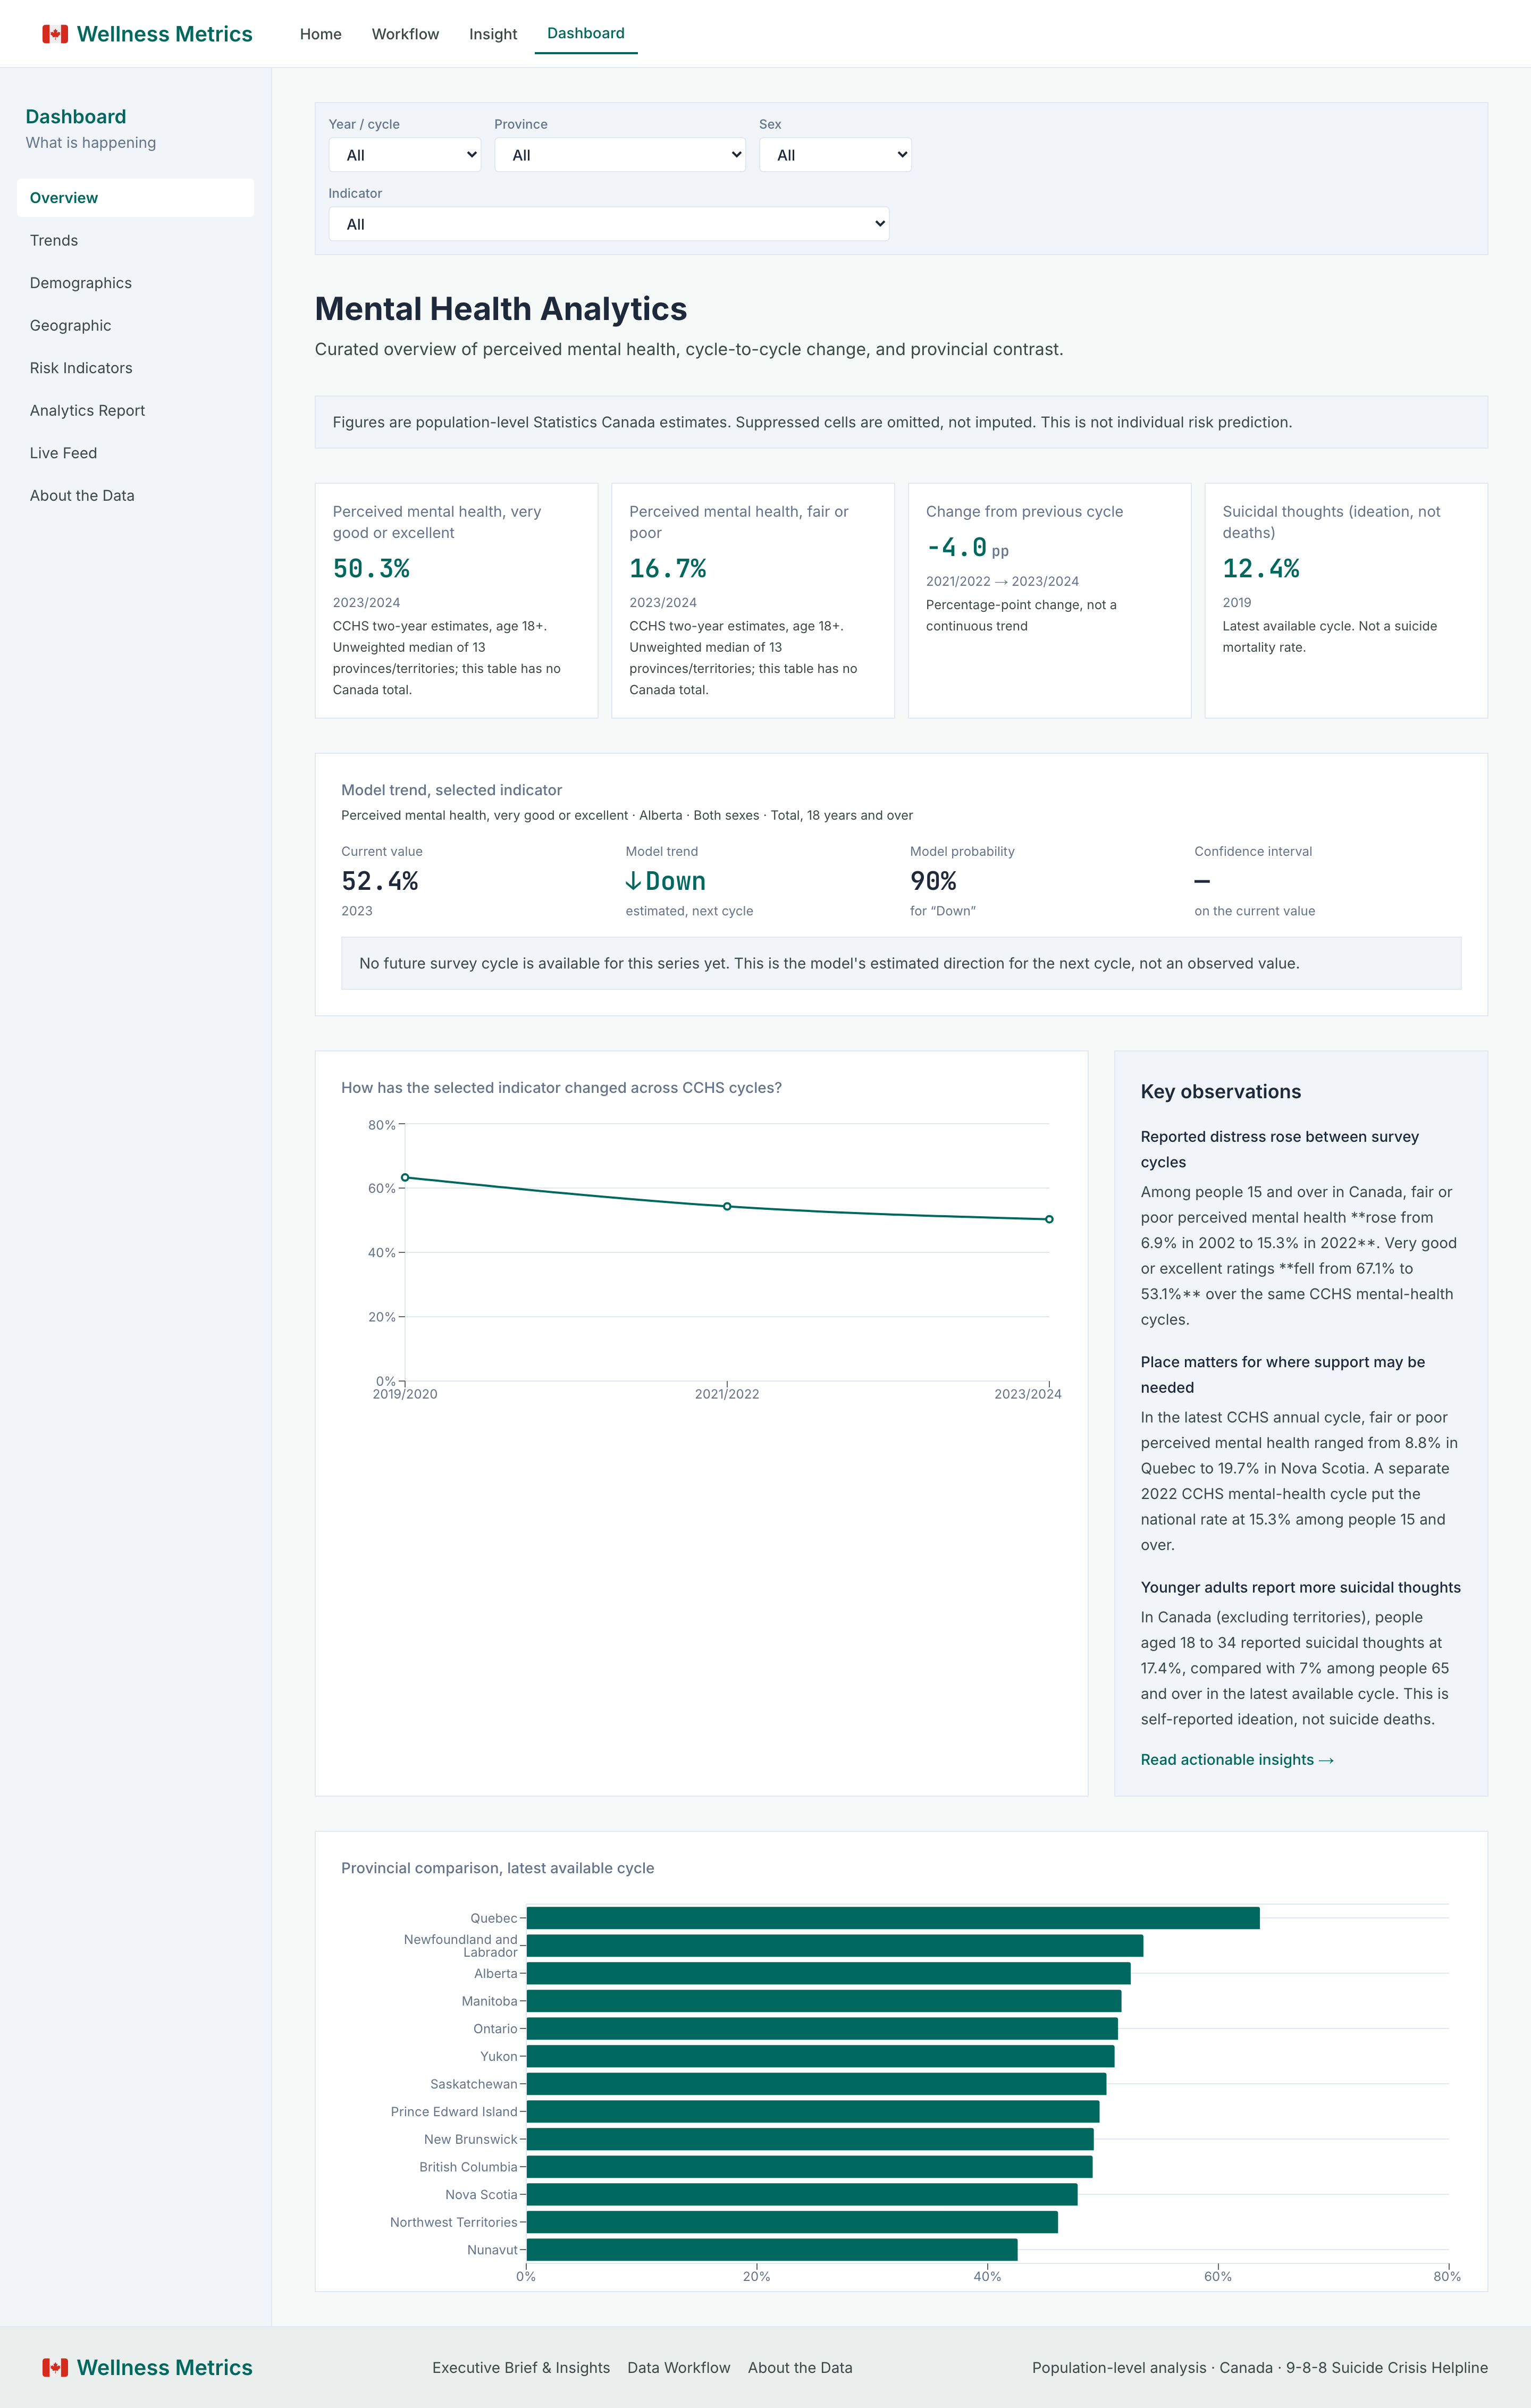
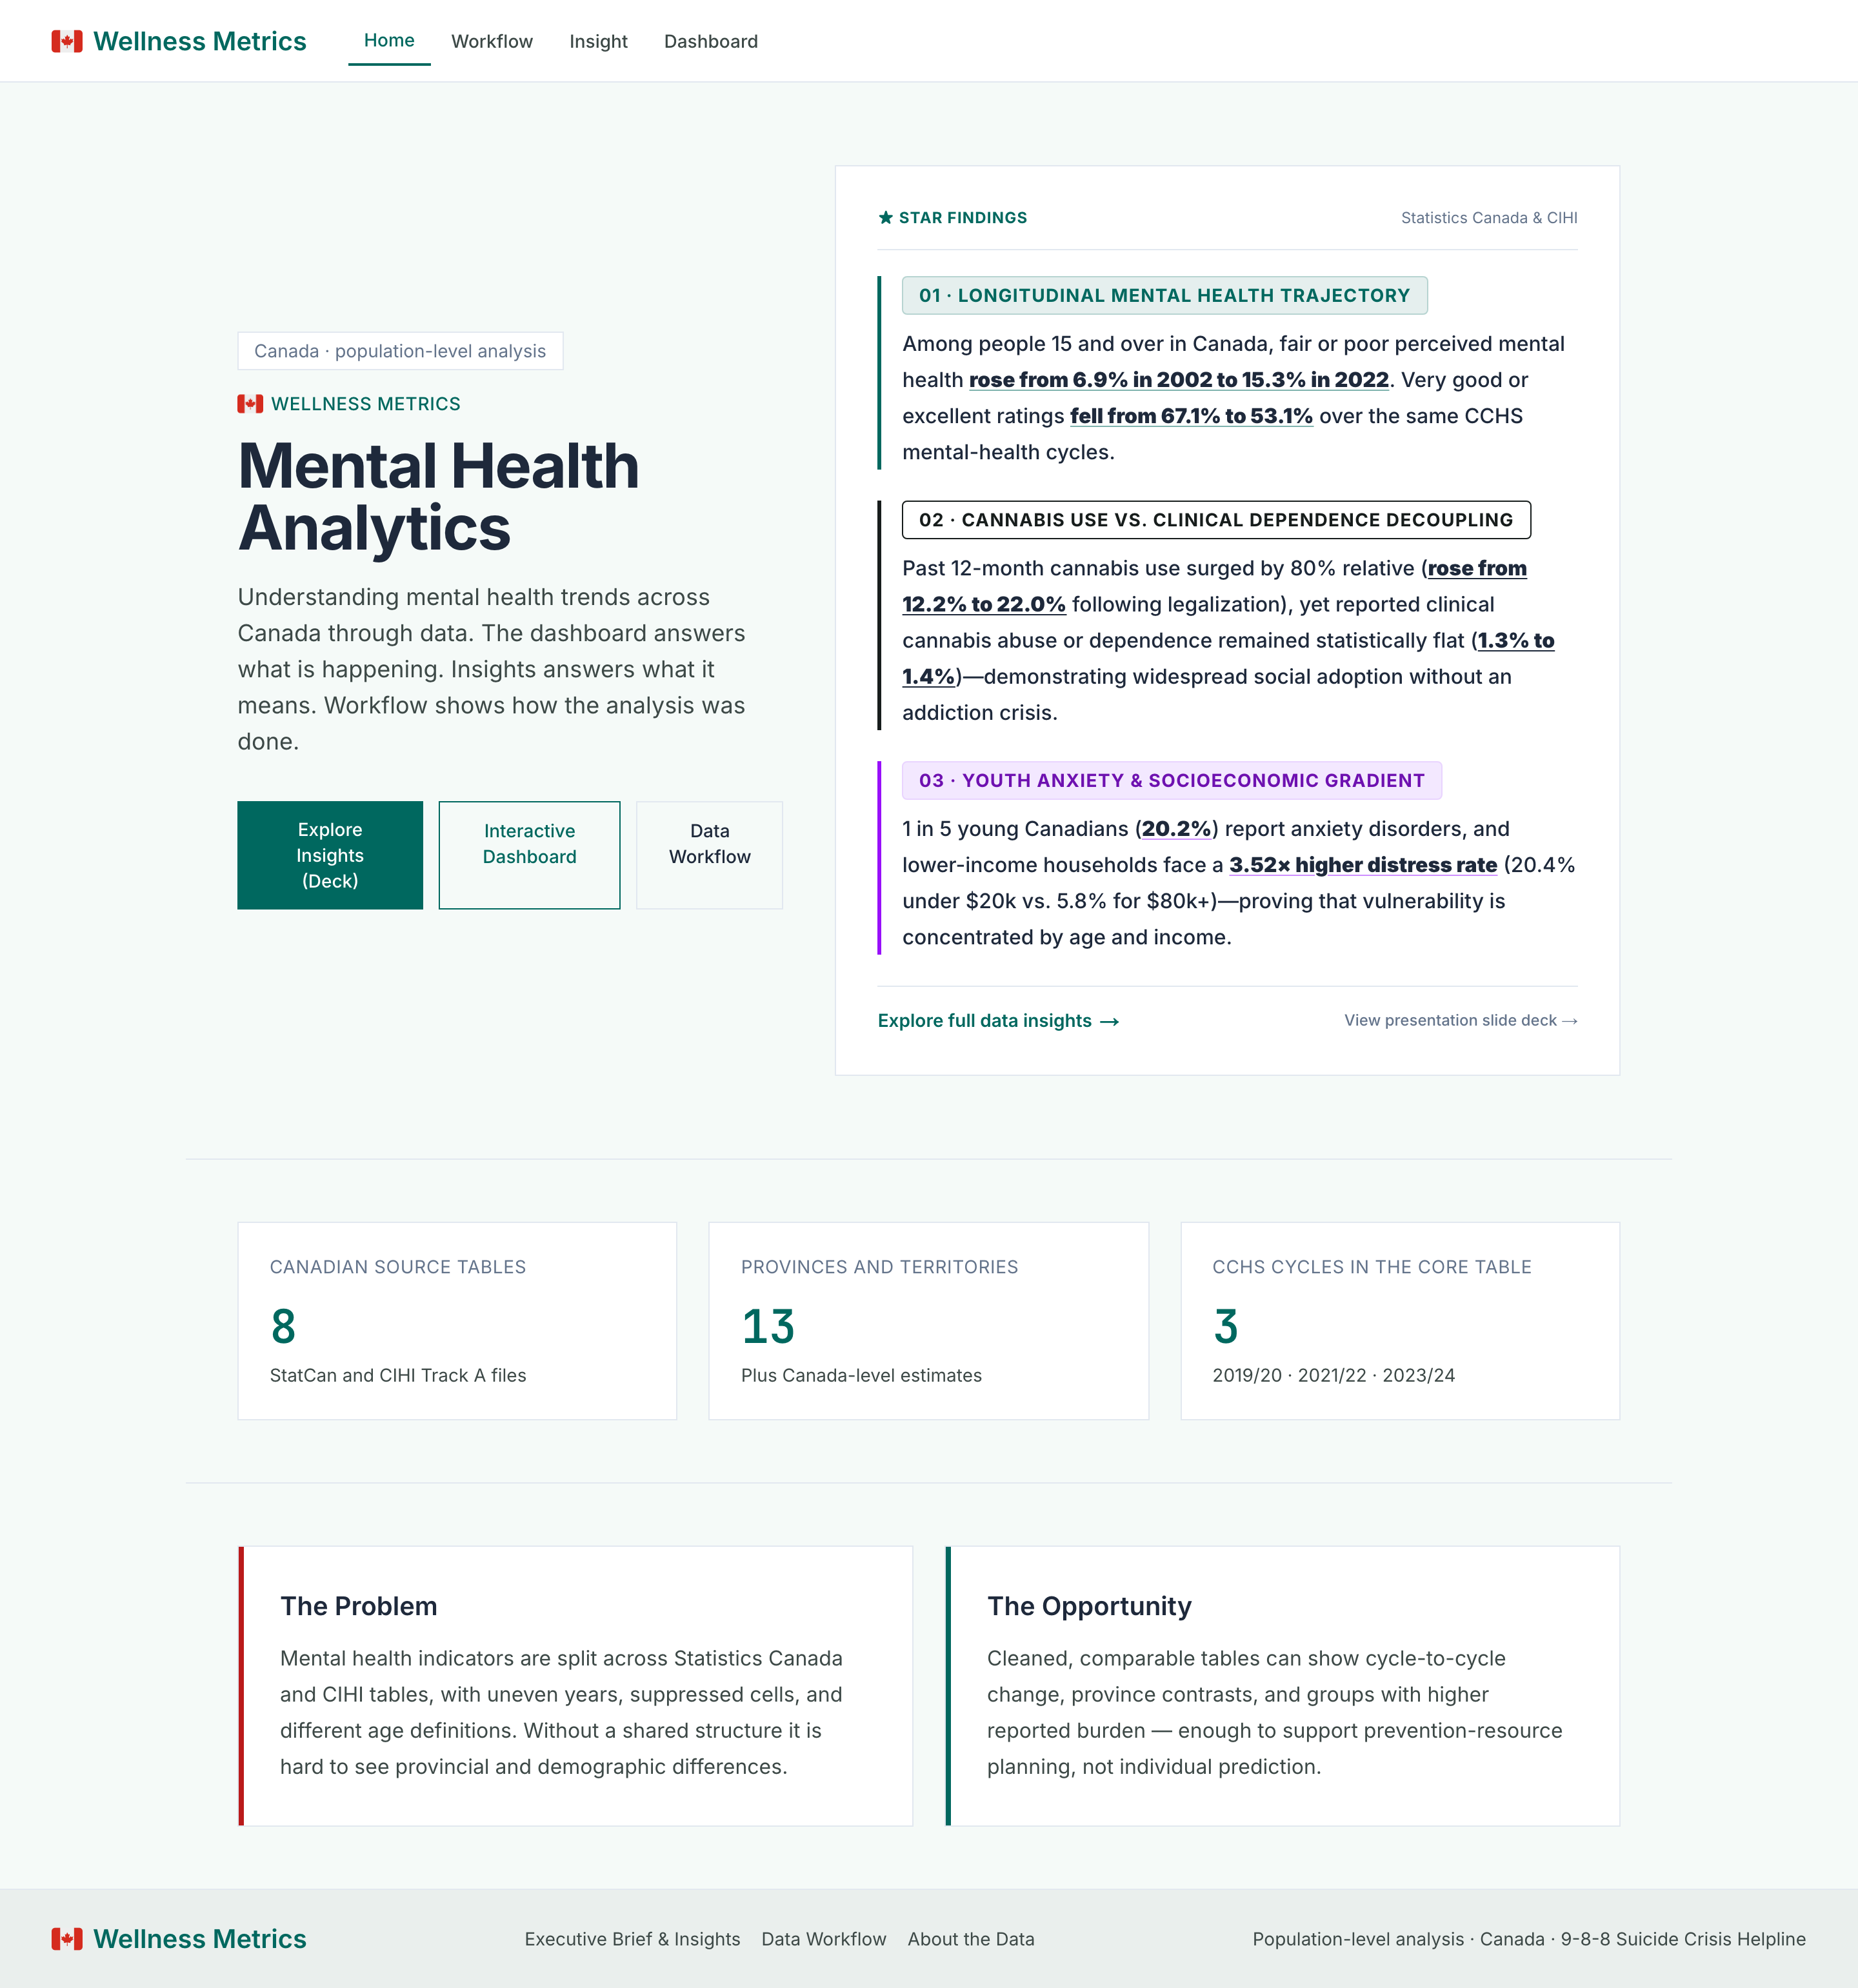
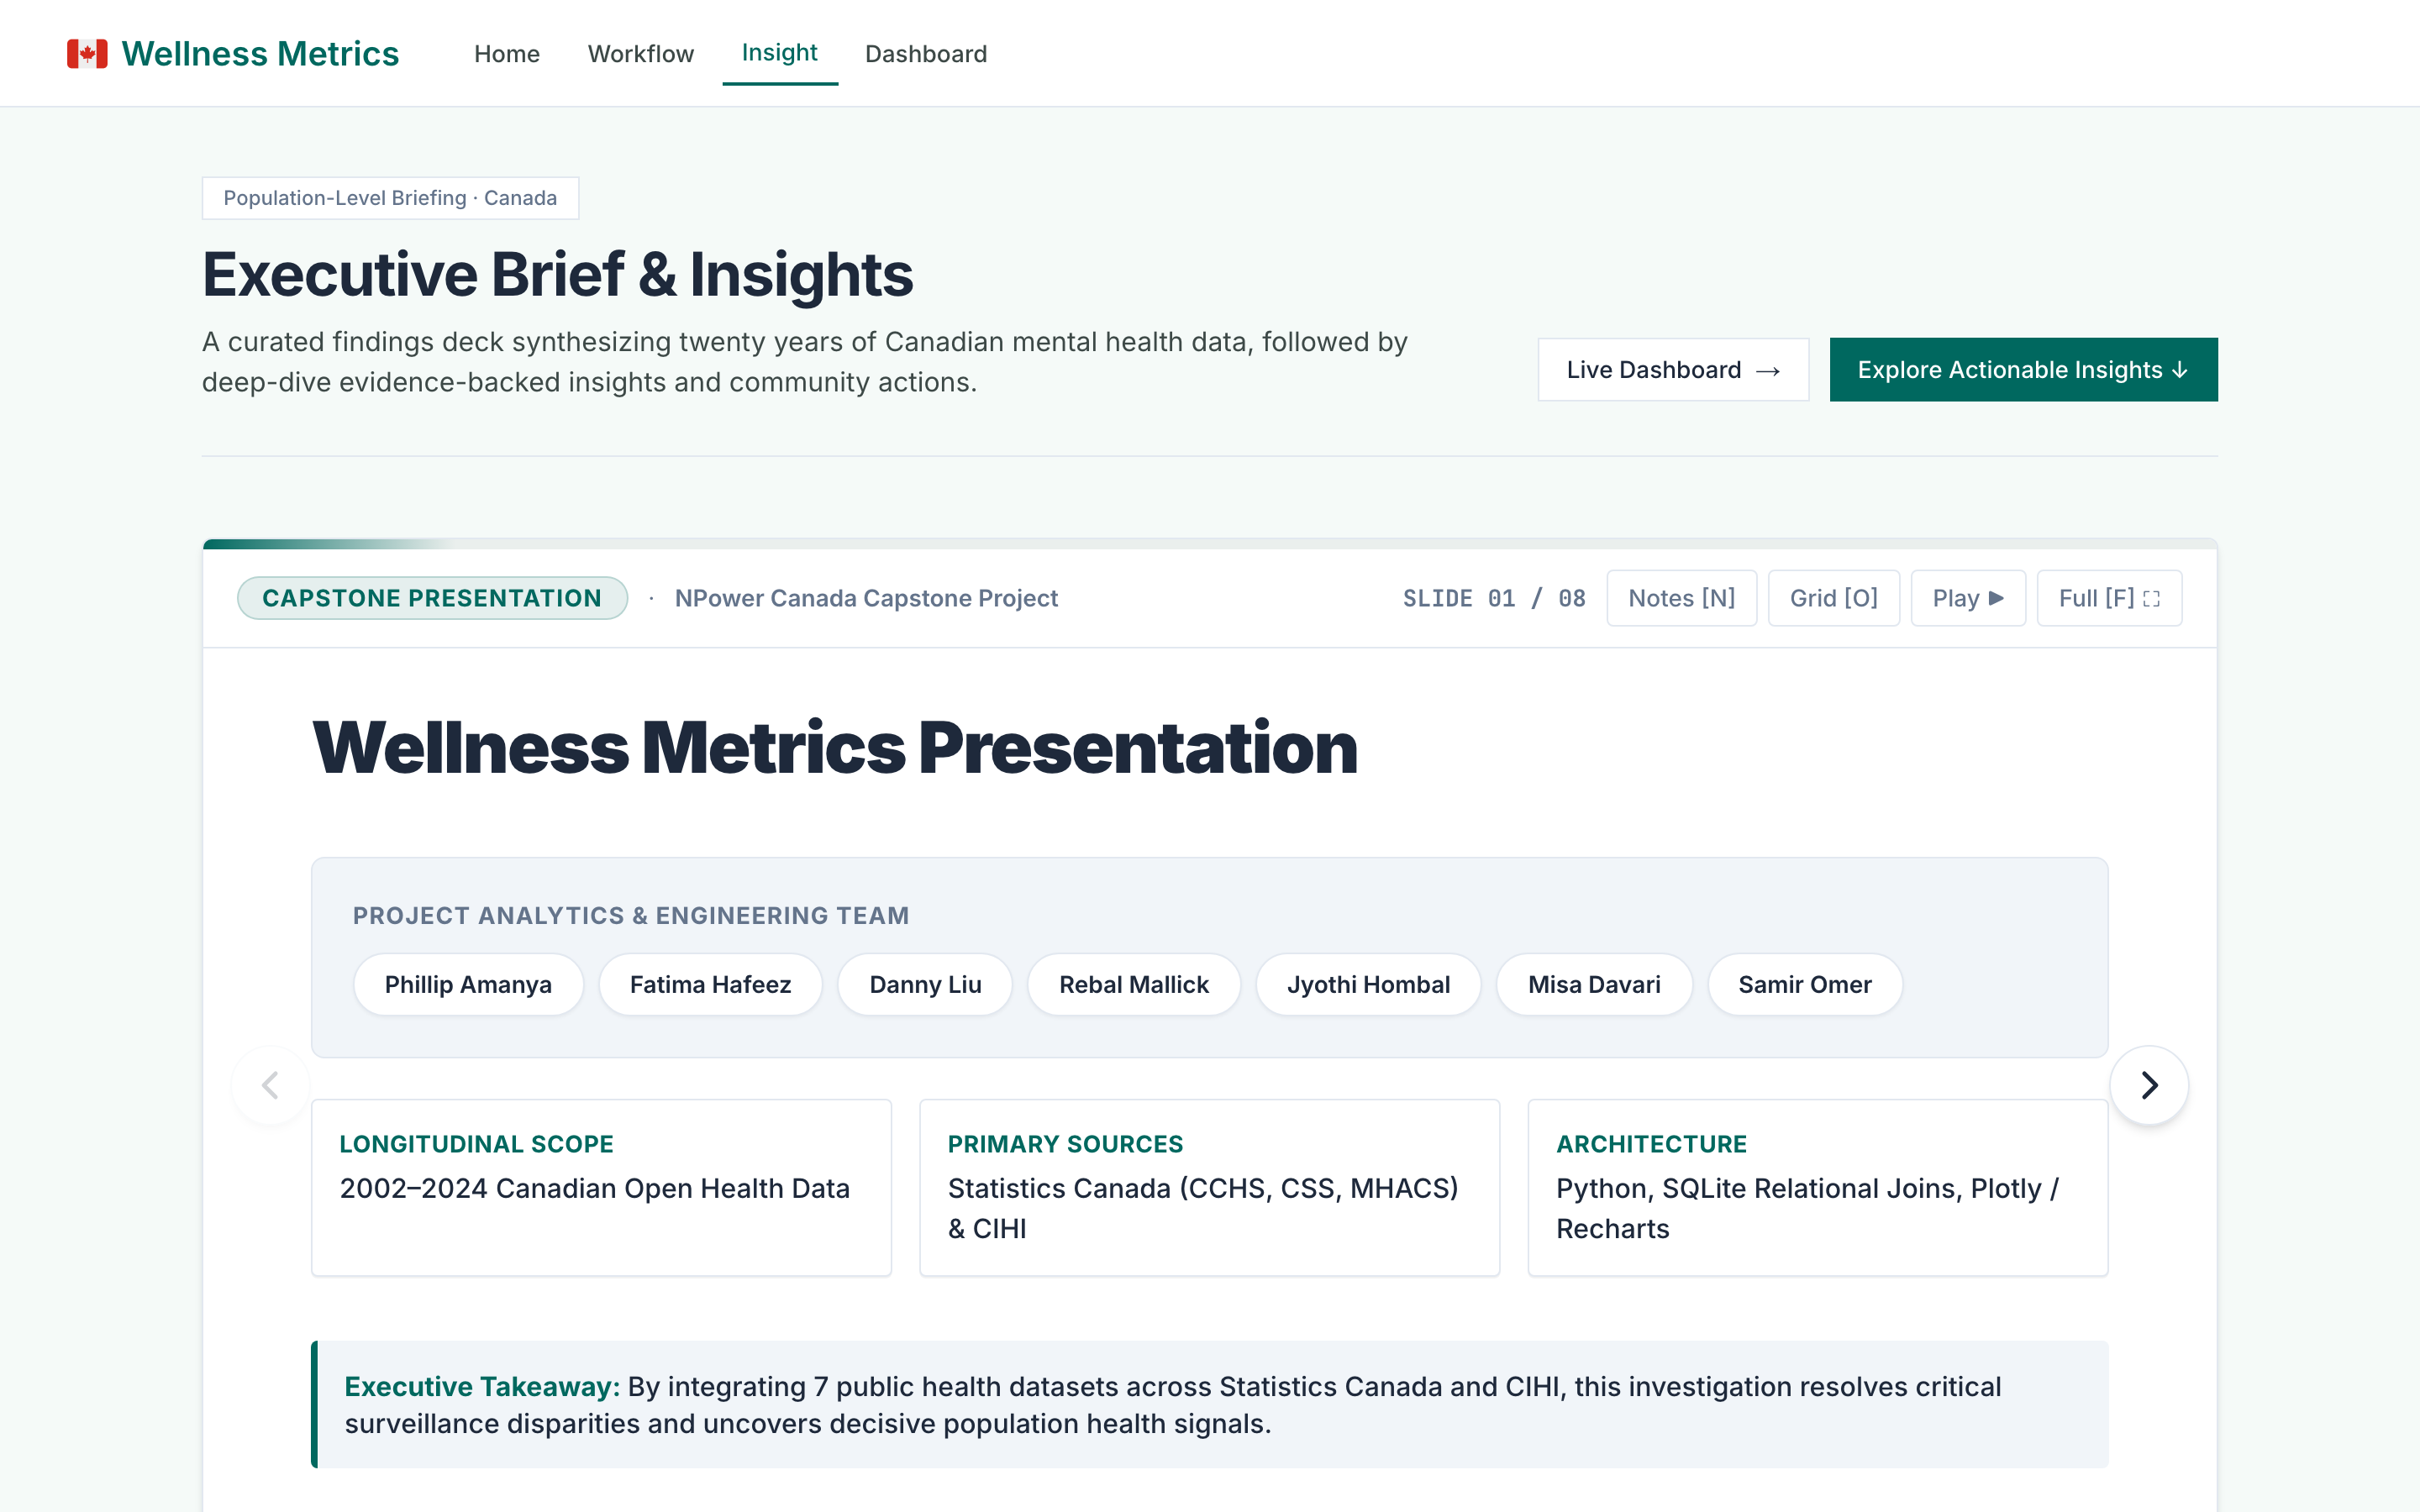
A team data-analytics project that turned three government mental-health datasets into a live, explorable dashboard with SQL analysis and a deployed prediction API.
Key findings
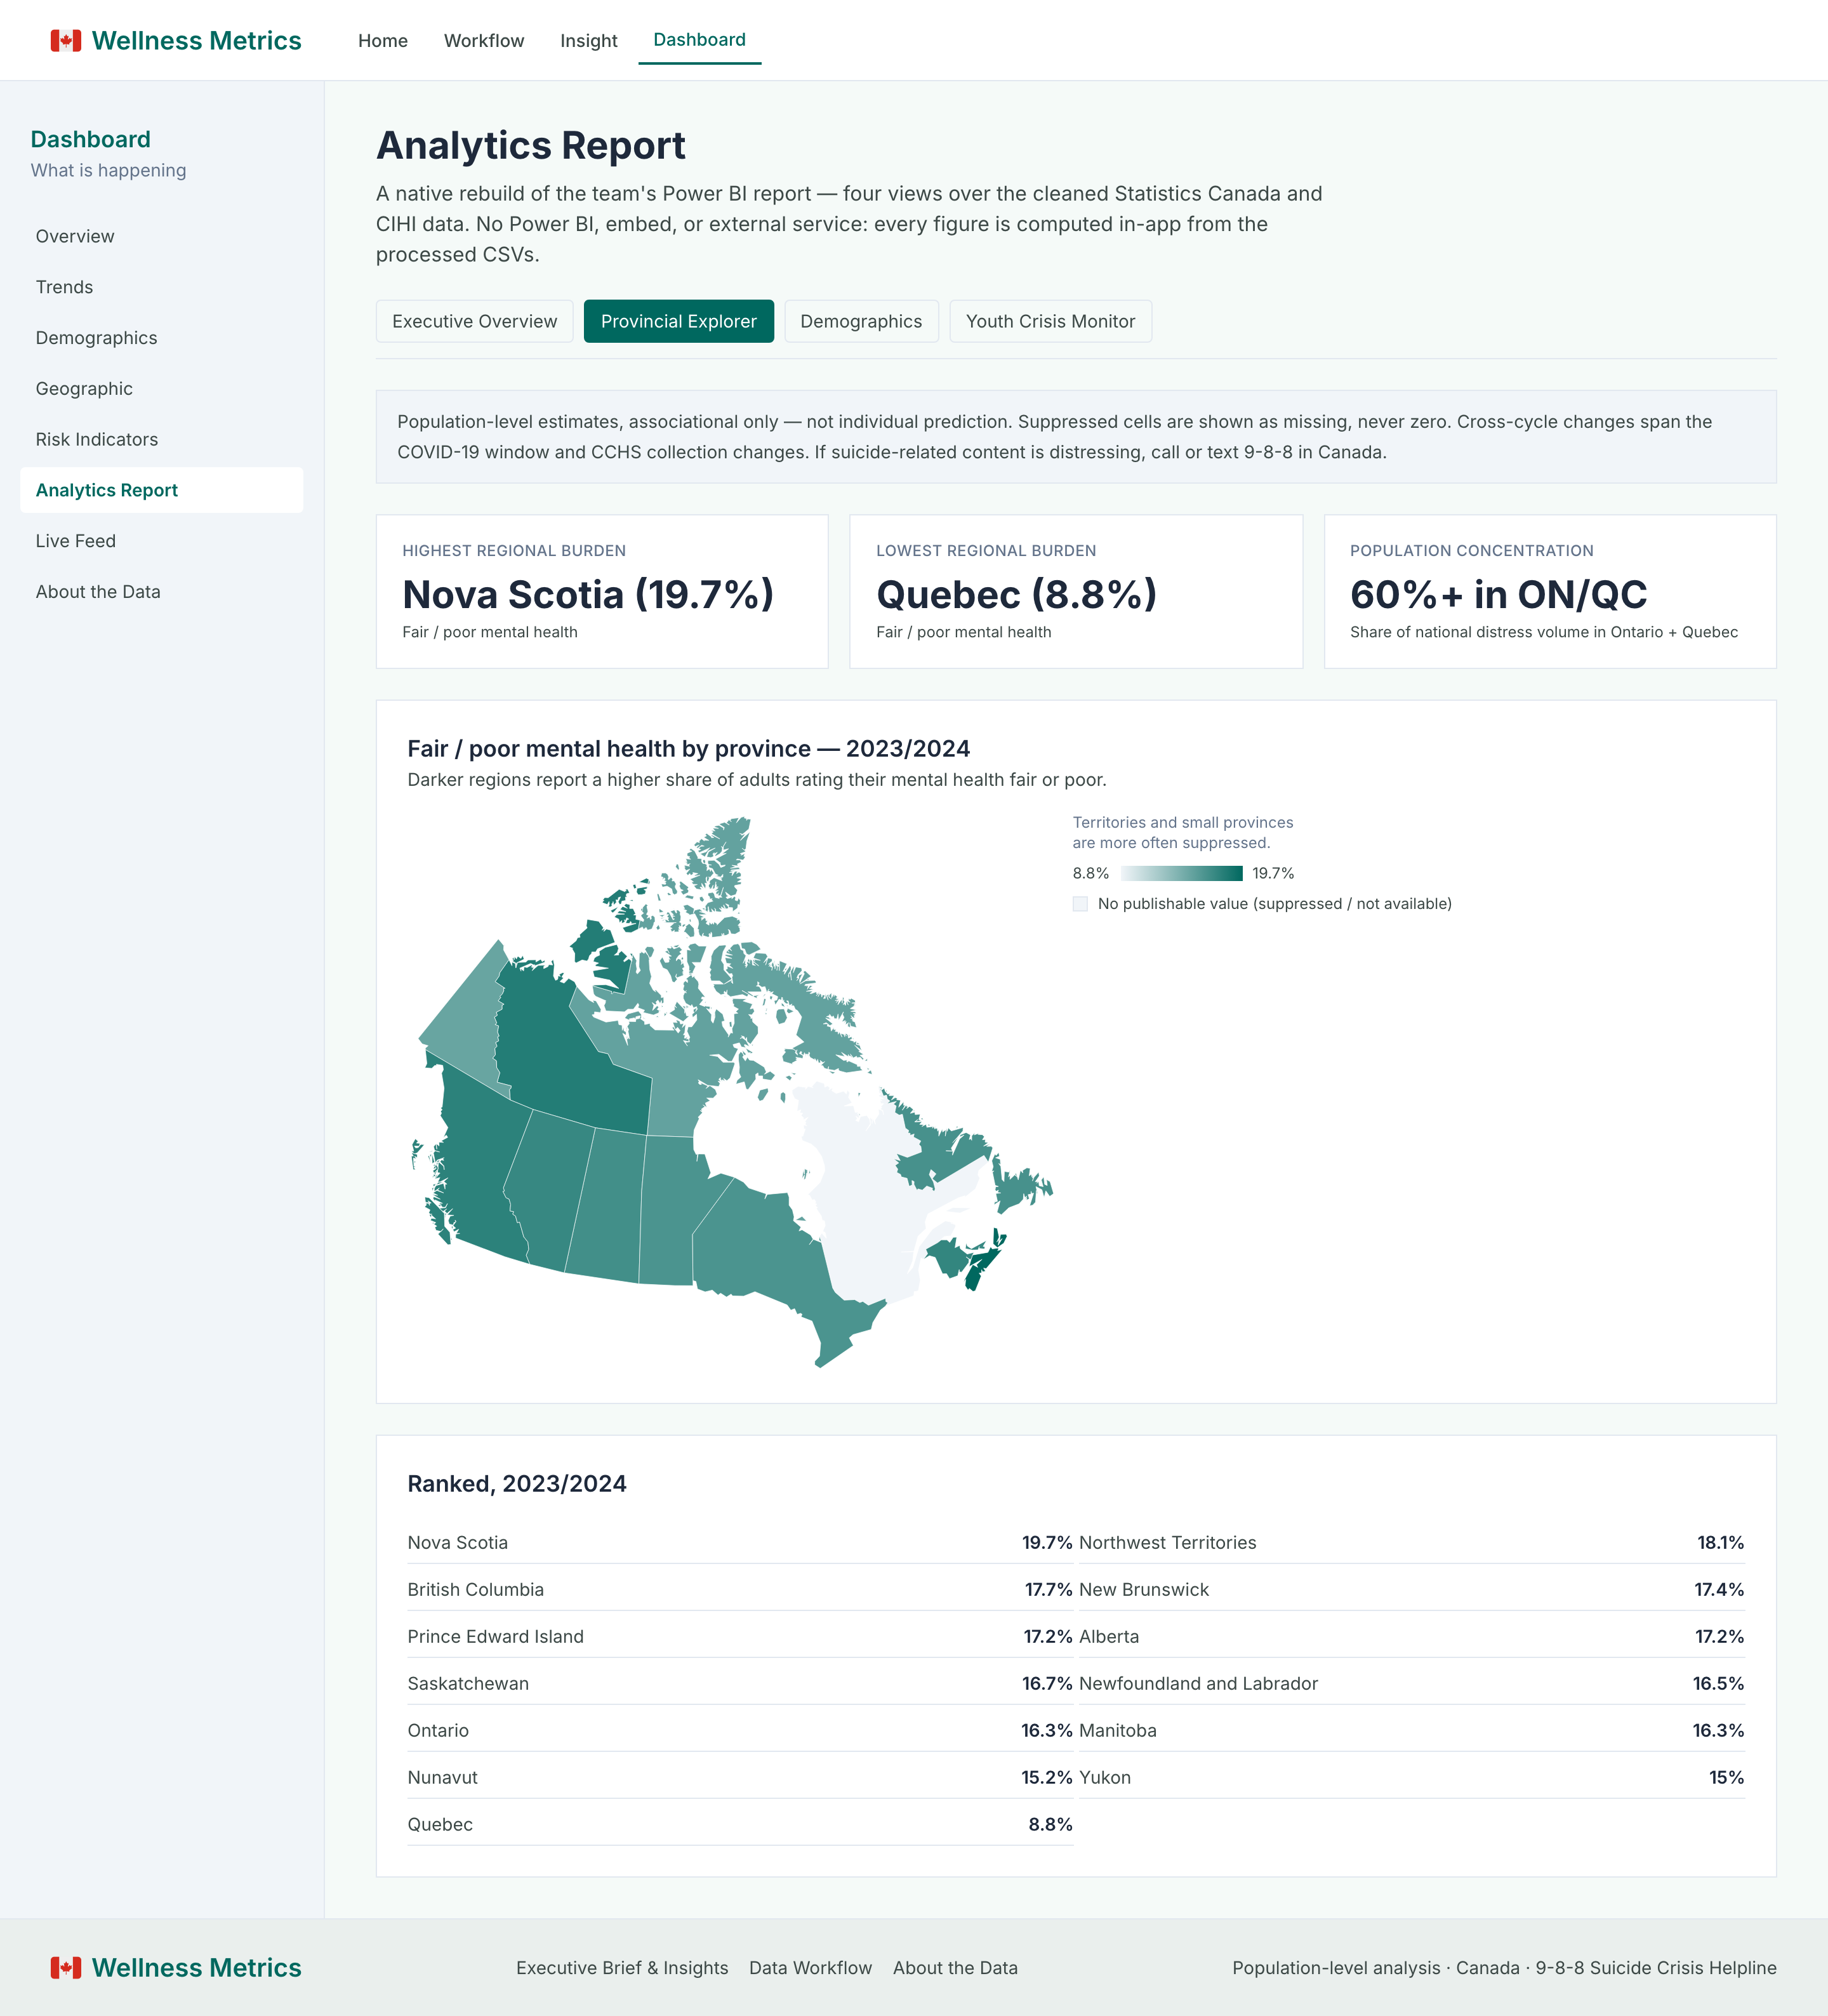
Provincial mental-health burden varies sharply across Canada
Why it matters: Regional comparisons help focus public-health attention where indicators diverge most
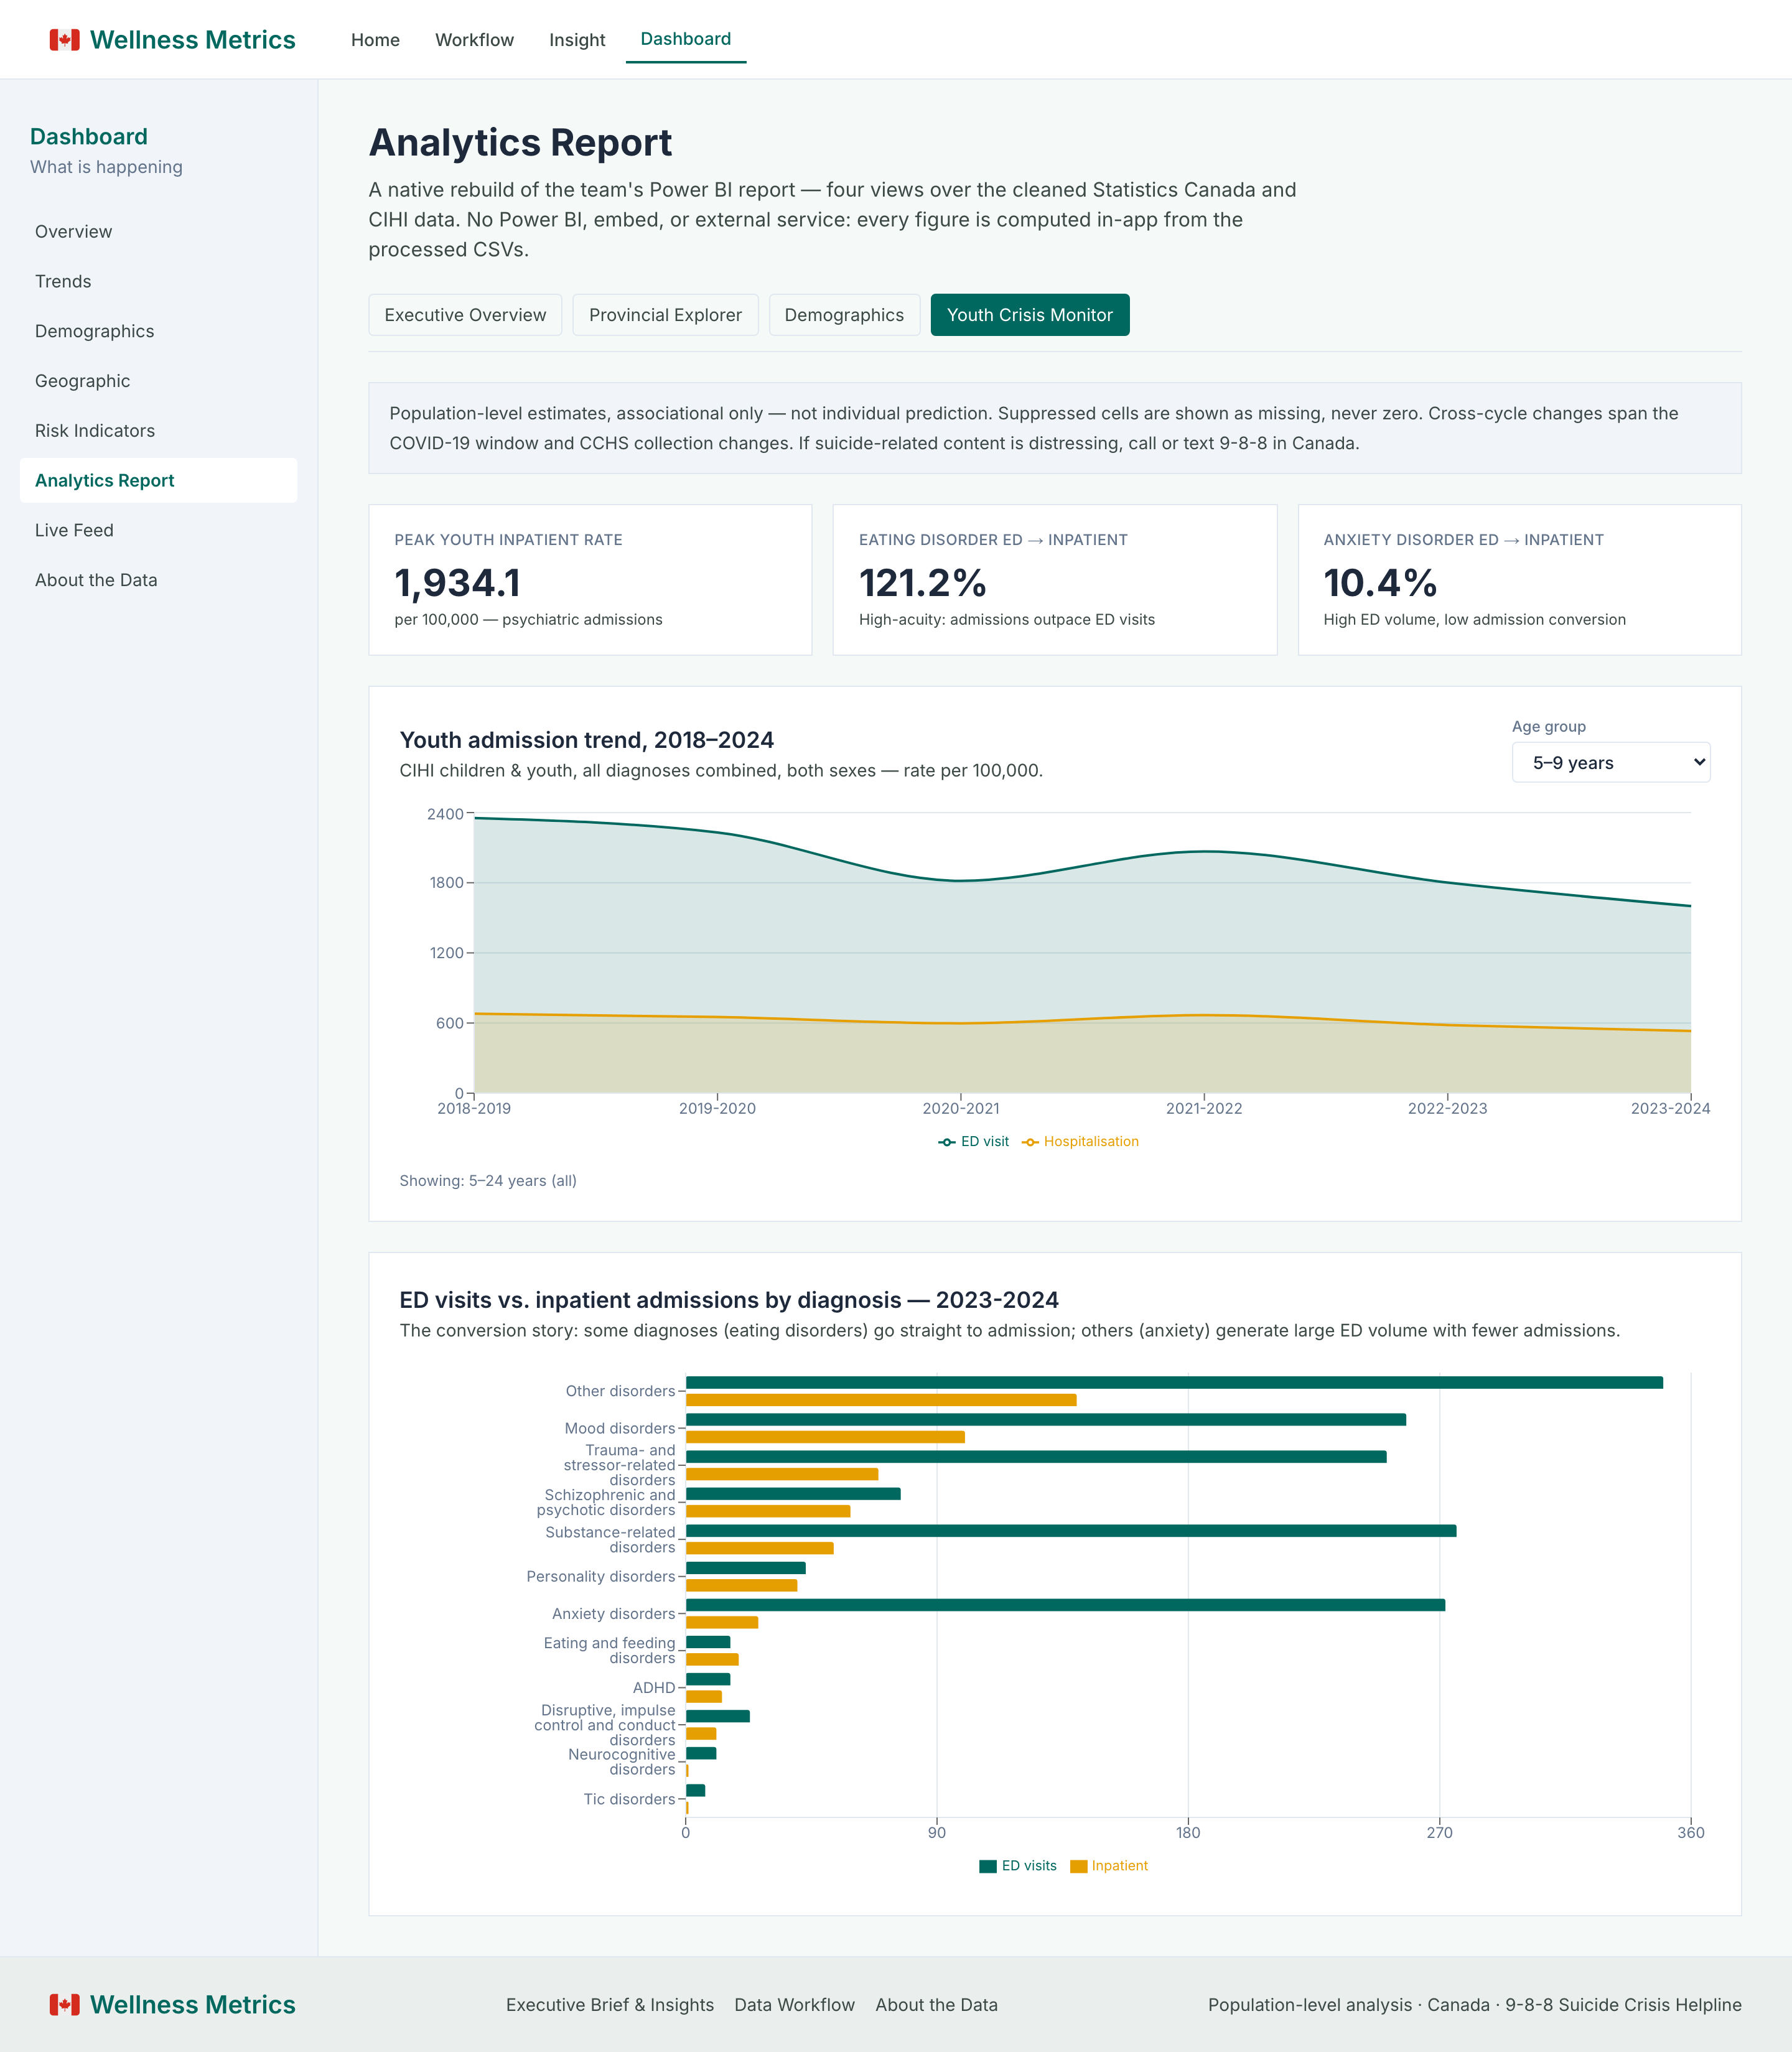
Youth crisis indicators (ED visits and hospitalizations) show distinct trends from overall population measures
Why it matters: Children's mental-health pressure may require different policy responses than adult trends
Impact
Potential
Supports faster exploration of public mental-health trends; formal measured outcomes depend on stakeholder adoption.
How this approach can help a business
Organizations reviewing public-health trends can explore provincial and demographic patterns without relying on static reports — with associational framing and clear caveats built in.
What I did: Cleaned StatCan and CIHI exports, built a 27-question SQL layer, shipped a Next.js dashboard, and deployed a FastAPI live prediction service.
Insights are associational, not causal, and framed at the population level
Suicide-related figures include Canada's 9-8-8 crisis helpline context
No individual risk-scoring — population-level analysis only
Overview
A team data-analytics project analyzing population-level mental health trends across Canada, built with project collaborator Rebal and from three real government sources: Statistics Canada's Canadian Community Health Survey (CCHS), CIHI hospital and emergency-department records, and StatCan's public-use microdata file (MHACS).
The goal was to go beyond a static report and ship something people could explore — a live dashboard, not just charts in a notebook.
Key features
Data pipeline — cleaned and profiled 8 raw StatCan and CIHI exports in Python
SQL analysis layer — 27 business questions against SQLite using CTEs and window functions
MHACS microdata track — worked directly with survey weights and government codebooks
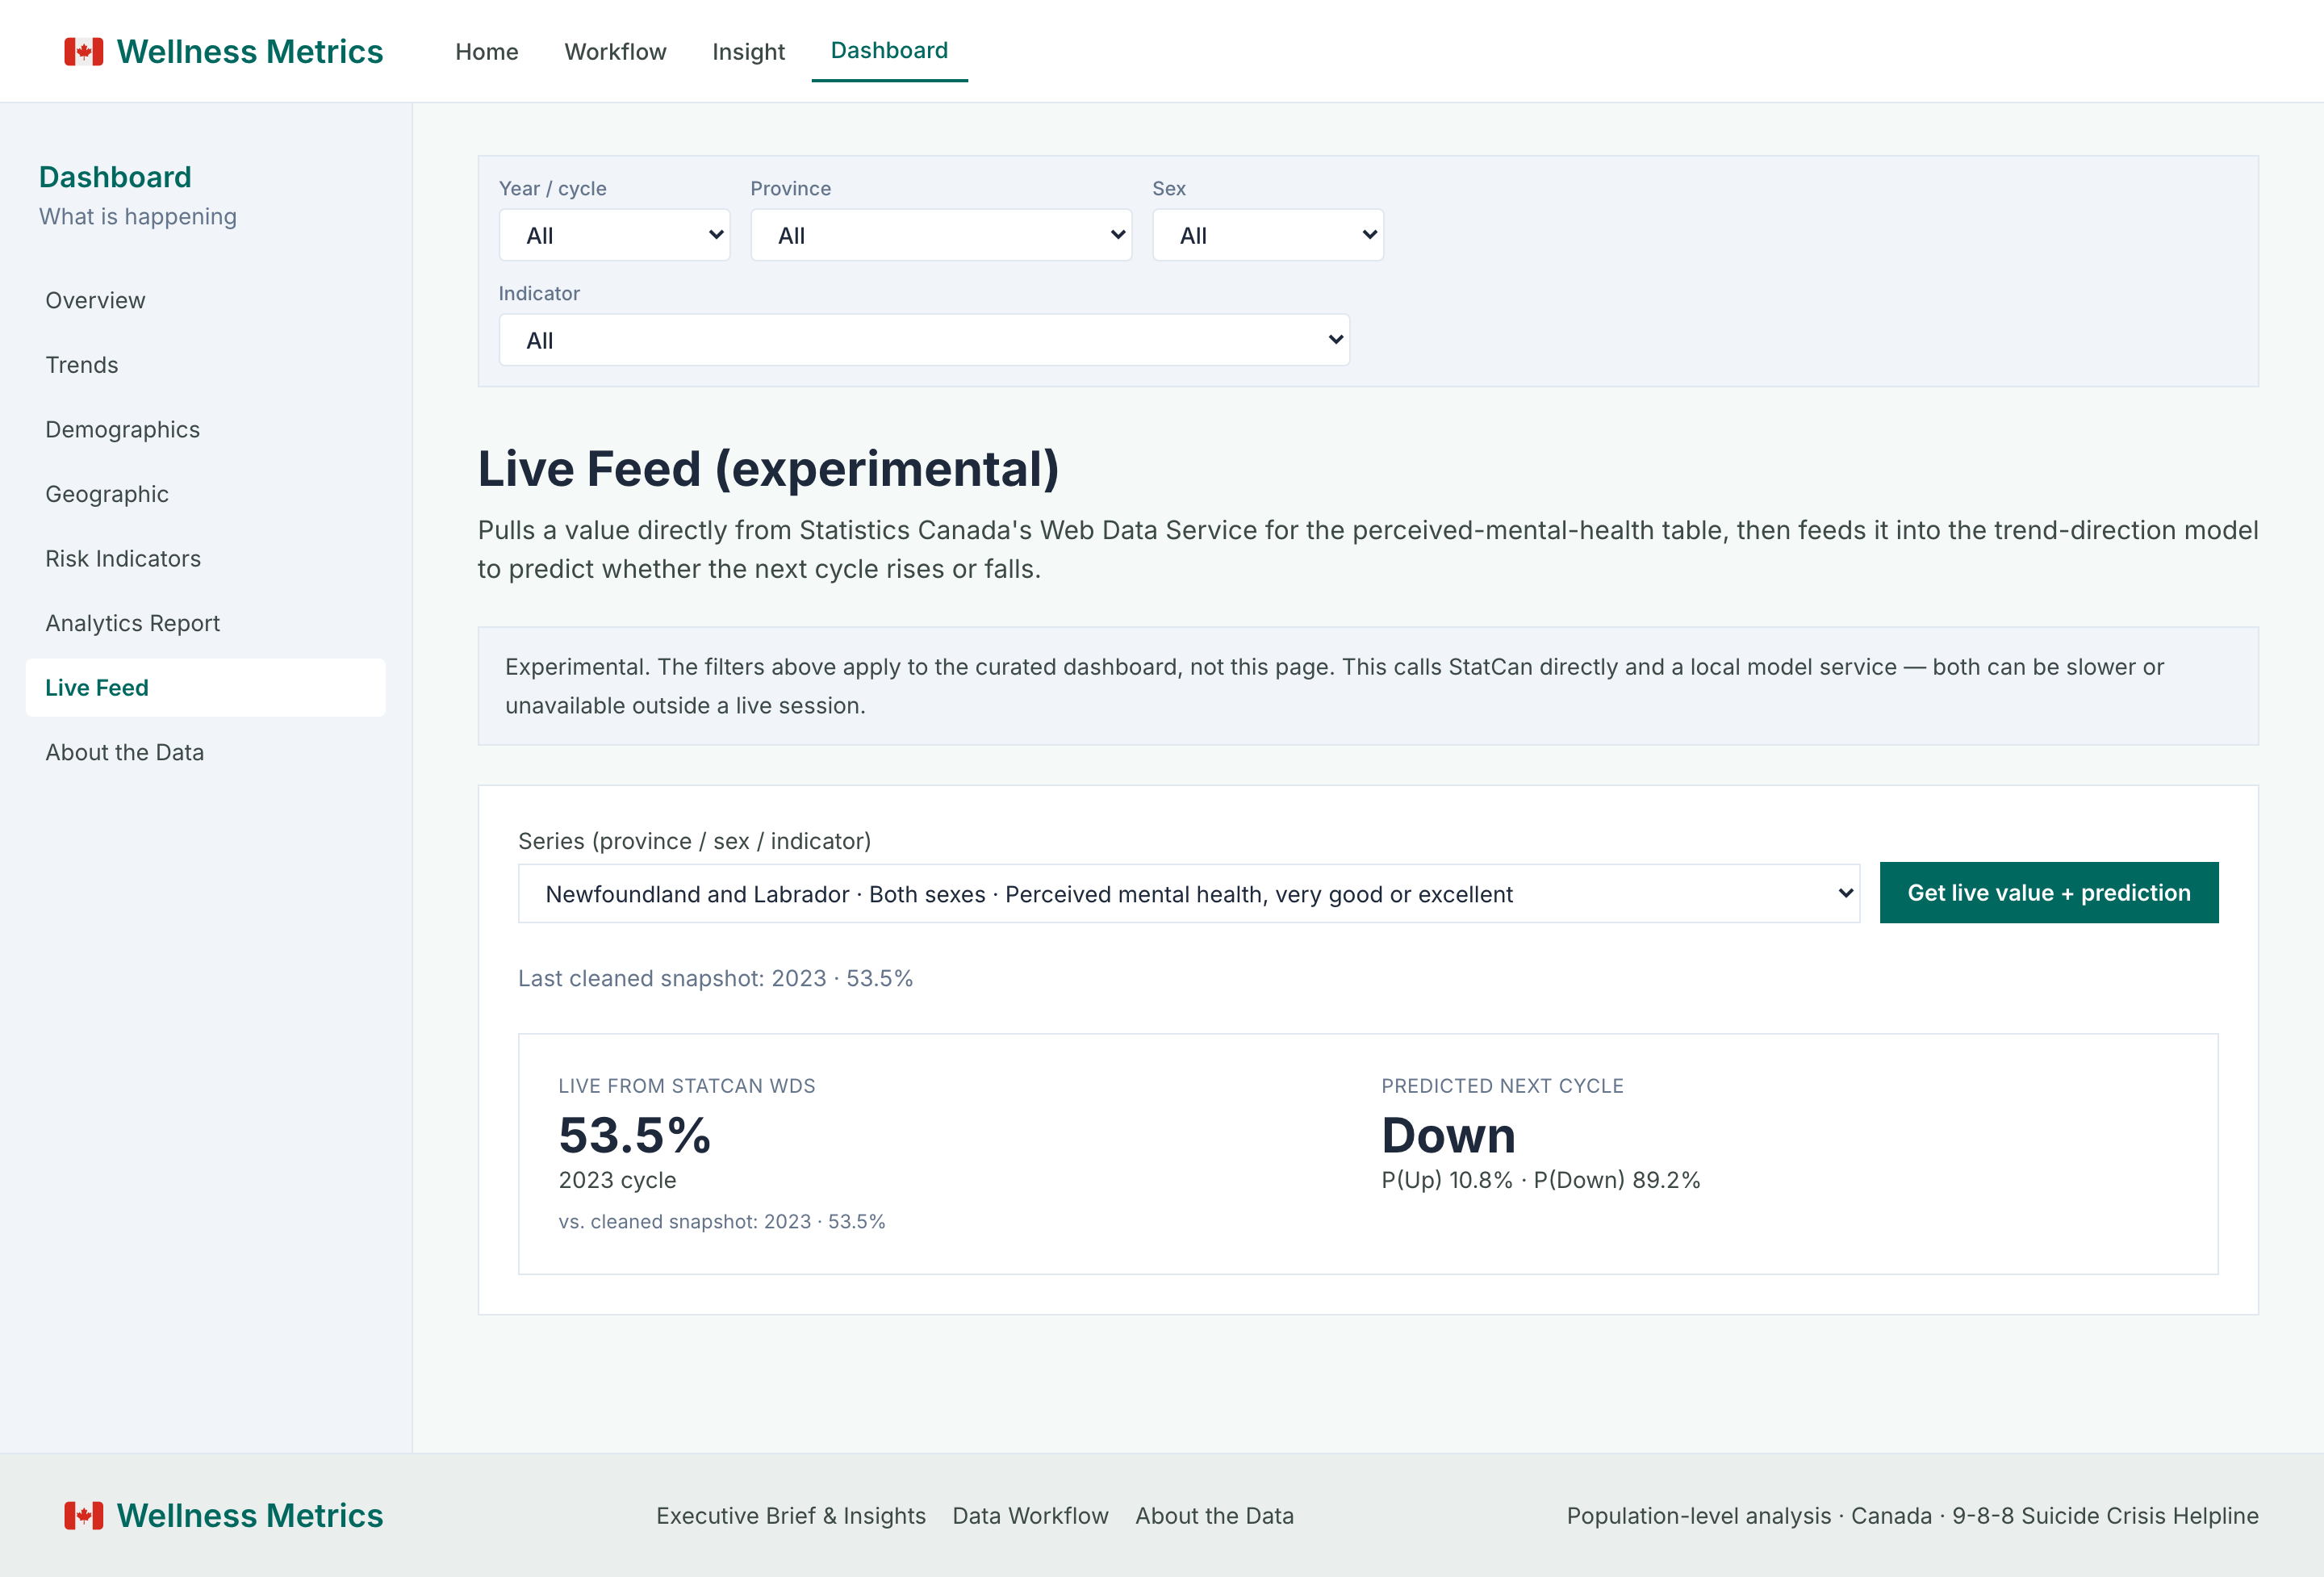
Live Feed — FastAPI service on Railway pulling fresh values from StatCan's public API and running them through a trained trend-direction model (~76% held-out accuracy)
Responsible framing — associational (not causal) insights at the population level, with crisis helpline context where appropriate
Technical focus
End-to-end ownership across the pipeline: Python data cleaning and profiling, SQL analytics, Next.js/TypeScript frontend with Recharts and a hand-rolled choropleth map, and a separately deployed FastAPI microservice for live ML predictions. Deployed on Vercel (frontend) and Railway (model service).
Because the subject matter is sensitive, every insight is written to be associational rather than causal, framed at the population level (never individual risk-scoring), and any suicide-related figure is paired with Canada's 9-8-8 crisis helpline.